Published January 16, 2015.
The complete ‘big HP spreadsheet’ can be built by pasting in the columns, one at a time. I can’t promise that it’s easy, or that the spreadsheet is accurate. If you use much of the spreadsheet in a published piece, please give fair credit to ‘sinksmith’ with the link https://kitchensinkinvestor.wordpress.com/more/articles/articles-2015/build-big-hp-spread/ or if that’s too long, https://kitchensinkinvestor.wordpress.com/index/ . Obviously I have no copyright on my source, the 10-Ks filed with the SEC.
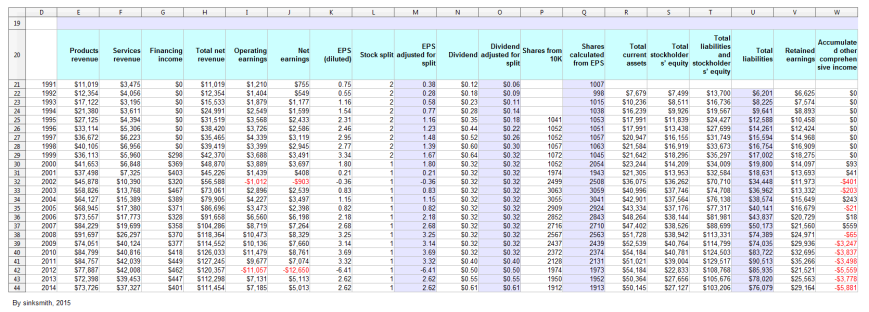
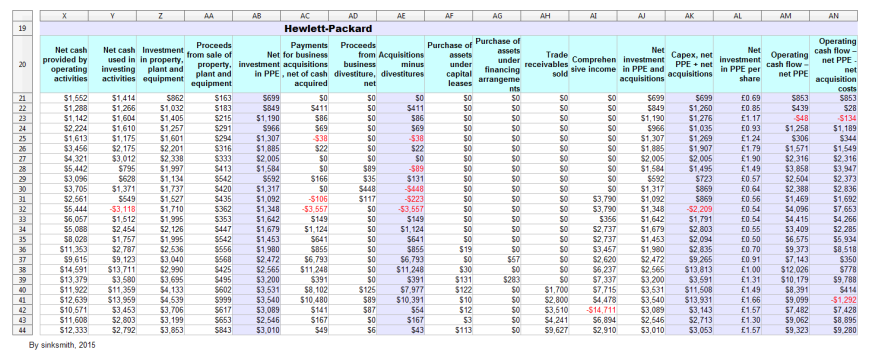
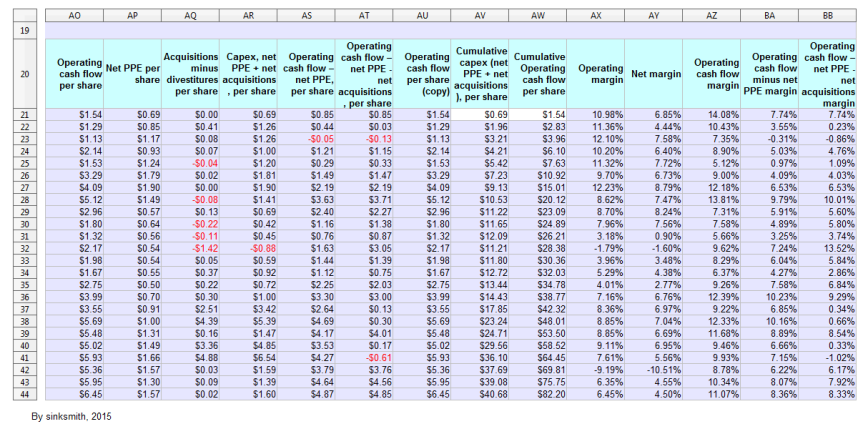
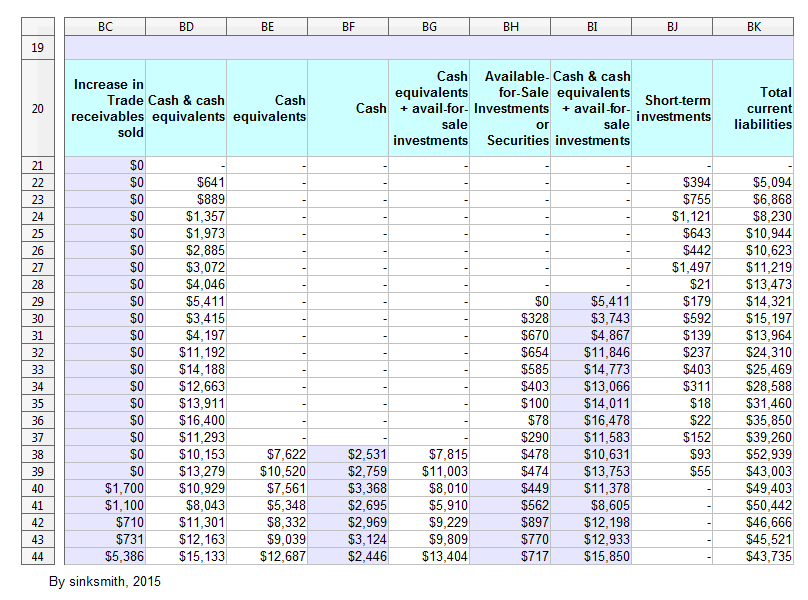
First, I show the spreadsheet in 4 sections:
—————————————————————————————————————
Next I show the formula view. Columns which hold data and not formulas won’t look much different:
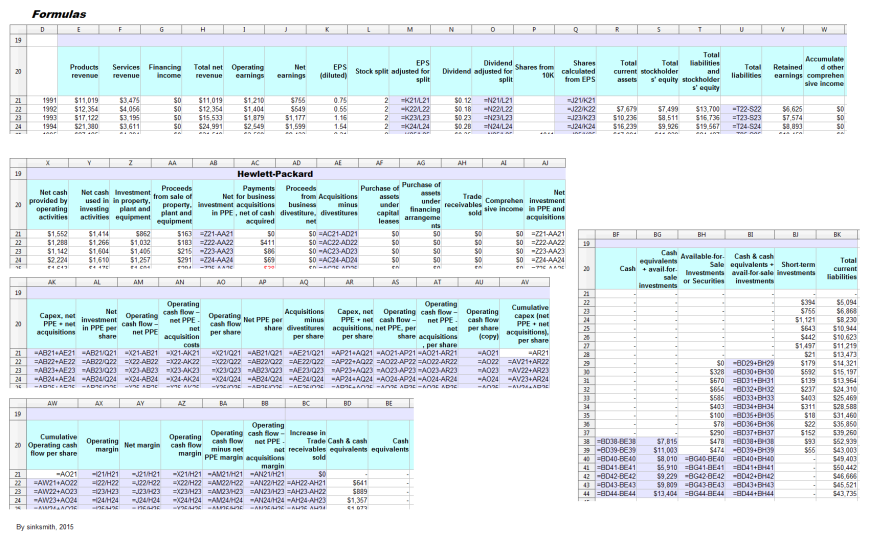
—————————————————————————————————————
If you only want the data columns, you can choose to use only the data columns you want, and place them wherever you like (but you won’t be able to use my formulas).
In the columns after “This is the data” … (below), each column has:
1) a cell address
2) an indication of the format you need to apply
3) a column header like “Products revenue”, “Services revenue” etc. (except for the years in the first column)
4) either column data or a formula, or in some cases a mixture of both.
The first column is the years 1991 to 2014. The first five lines are:
D21
num
1991
1992
1993
“D21” is the cell address, which will have “1991” pasted into it. The format code “num” means numeric format. If you paste in the ‘year’ column and it doesn’t look right, set the format to ordinary numbers (not dates) with no decimal places (and no decimal point).
All the other columns start at row 20, with a heading at the top.
The formats are:
$ – currency, with no decimal point
$.cc – currency, dollars-and-cents format as in $1.23
% – percentages
num – numeric, with no decimal point (for the year and numbers of shares)
Obviously you don’t apply those to the column headings, which you can put in any format you like.
If you have problems pasting-in the numbers, try copying the column data into a basic text editor like Microsoft Notepad (with Word Wrap turned off, in the Format menu). The problem might be codes that you don’t see in the browser but which are picked up when you copy. Pasting into Notepad will either drop the unwanted codes, or make them visible in Notepad so you can delete them.
I tested these instructions and was able to copy from the Firefox browser and use the normal ‘Ctrl_v’ paste, but if you have problems you could try right-clicking to get ‘Paste Special’ and choose ‘Unformatted text’ (if the text is already unformatted, the option won’t be shown). I also checked that the 2014 figures were the same in my built-from-here version as in my original spreadsheet.
Some balance sheet quantities have no entry for 1991, which I represent by a blank line. The first of these is column R, where I have –
R20
$
Total current assets
7679
10236
16239
(etc.)
Make sure that “7679” is in R22 (row 22 is for 1992) and paste the heading and the figures seperately if necessary to get the blank cell below the heading.
Column P20 is “Shares from 10K”. It starts with four zeros, which ought to be blank, but WordPress ignores consecutive returns (I’m using their free version). The ten years of zero Comprehensive income in column AI are a case where zeros should be interpreted as ‘no data’. If you choose to delete all consecutive zeros that start in 1991, the columns affected will accurately imply ‘no data’, but it may affect some calculations.
Column M is the first with a formula (rather than data) –
M20
$.cc
EPS adjusted for split
=K21/L21
=K22/L22
I give the first two formulas, but in most cases you should only need the first, and then be able to extend down (the second formula will let you check that extending down has worked properly).
There are exceptions. Two are for cumulative data where the first line starts the total and subsequent lines update the total. Another exception is a column to calculate an increase over the previous year. In those cases I give three lines, as here:
AV20
$.cc
Cumulative capex (net PPE + net acquisitions), per share
=AR21
=AV21+AR22
=AV22+AR23
In column BF (Cash), there’s no data for the formula until row 38 (for 2008), so there’s a code for the heading (“Cash”, on row 20) followed by the code for the formula, like this:
BF20
Cash
BF38
$
=BD38-BE38
=BD39-BE39
In columns BH and BI, the formulas also don’t start at or near the top. I’ve put every formula in, so you just need to copy and paste the whole column (without needing to extend the formula down).
Finish by adding a note that amounts are in millions except for per-share data, add an overall heading if you like, and format the headings, add tinted backgrounds etc. as you like.
A tip for overseas readers – I use OpenOffice Calc (it’s free), and by default I get the ‘£’ currency symbol, not ‘$’. I have not found a way to change the default currency for a document, and I have to use Format Cells. If you have the same problem, in the ‘Format Cells’ dialog, set the language to ‘English (USA)’ under ‘Language’ BEFORE choosing ‘Currency’. Then, when ‘Currency’ is selected, you should automatically get ‘USD $ English (USA) under ‘Format’. Otherwise, you have to select that option from near the end of a very long list. (An alternative is to leave the formatting until everything is entered, then Select All, Format Cells, and in the dialog, set the language to ‘English (USA)’ under ‘Language’, and then format individual columns or blocks of them.)
This is the data, with the top cell address of each column and the format codes (which you don’t paste in) in bold italic –
D21
num
1991
1992
1993
1994
1995
1996
1997
1998
1999
2000
2001
2002
2003
2004
2005
2006
2007
2008
2009
2010
2011
2012
2013
2014
E20
$
Products revenue
11019
12354
17122
21380
27125
33114
36672
40105
36113
41653
37498
45878
58826
64127
68945
73557
84229
91697
74051
84799
84757
77887
72398
73726
F20
$
Services revenue
3475
4056
3195
3611
4394
5306
6223
6956
5960
6848
7325
10390
13768
15389
17380
17773
19699
26297
40124
40816
42039
42008
39453
37327
G20
$
Financing income
0
0
0
0
0
0
0
0
298
369
403
320
467
389
371
328
358
370
377
418
449
462
447
401
H20
$
Total net revenue
11019
12354
15533
24991
31519
38420
35465
39419
42370
48870
45226
56588
73061
79905
86696
91658
104286
118364
114552
126033
127245
120357
112298
111454
I20
$
Operating earnings
1210
1404
1879
2549
3568
3726
4339
3399
3688
3889
1439
-1012
2896
4227
3473
6560
8719
10473
10136
11479
9677
-11057
7131
7185
J20
$
Net earnings
755
549
1177
1599
2433
2586
3119
2945
3491
3697
408
-903
2539
3497
2398
6198
7264
8329
7660
8761
7074
-12650
5113
5013
K20
$.cc
EPS (diluted)
0.75
0.55
1.16
1.54
2.31
2.46
2.95
2.77
3.34
1.80
0.21
-0.36
0.83
1.15
0.82
2.18
2.68
3.25
3.14
3.69
3.32
-6.41
2.62
2.62
L20
num
Stock split
2
2
2
2
2
2
2
2
2
1
1
1
1
1
1
1
1
1
1
1
1
1
1
1
M20
$.cc
EPS adjusted for split
=K21/L21
=K22/L22
N20
$.cc
Dividend
0.12
0.18
0.23
0.28
0.35
0.44
0.52
0.60
0.64
0.32
0.32
0.32
0.32
0.32
0.32
0.32
0.32
0.32
0.32
0.32
0.40
0.50
0.55
0.61
O20
$.cc
Dividend adjusted for split
=N21/L21
=N22/L22
P20
num
Shares from 10K
0
0
0
0
1041
1052
1052
1057
1072
1052
1974
2499
3063
3055
2909
2852
2716
2567
2437
2372
2128
1974
1950
1912
Q20
num
Shares calculated from EPS
=J21/K21
=J22/K22
R20
$
Total current assets
7679
10236
16239
17991
17991
20947
21584
21642
23244
21305
36075
40996
42901
43334
48264
47402
51728
52539
54184
51021
54184
50364
50145
S20
$
Total stockholders’ equity
7499
8511
9926
11839
13438
16155
16919
18295
14209
13953
36262
37746
37564
37176
38144
38526
38942
40764
40781
39004
22833
27656
27127
T20
$
Total liabilities and stockholders’ equity
13700
16736
19567
24427
27699
31749
33673
35297
34009
32584
70710
74708
76138
77317
81981
88699
113331
114799
124503
129517
108768
105676
103206
U20
$
Total liabilities
=T22-S22
=T23-S23
V20
$
Retained earnings
6625
7574
8893
10458
12424
14968
16909
18275
14097
13693
11973
13332
15649
16679
20729
21560
24971
29936
32695
35266
21521
25563
29164
W20
$
Accumulated other comprehensive income
0
0
0
0
0
0
0
0
93
41
-401
-203
243
-21
18
559
-65
-3247
-3837
-3498
-5559
-3778
-5881
X20
$
Net cash provided by operating activities
1552
1288
1142
2224
1613
3456
4321
5442
3096
3705
2561
5444
6057
5088
8028
11353
9615
14591
13379
11922
12639
10571
11608
12333
Y20
$
Net cash used in investing activities
1414
1266
1604
1610
1175
2175
3012
795
628
1371
549
-3118
1512
2454
1757
2787
9123
13711
3580
11359
13959
3453
2803
2792
Z20
$
Investment in property, plant and equipment
862
1032
1405
1257
1601
2201
2338
1997
1134
1737
1527
1710
1995
2126
1995
2536
3040
2990
3695
4133
4539
3706
3199
3853
AA20
$
Proceeds from sale of property, plant and equipment
163
183
215
291
294
316
333
413
542
420
435
362
353
447
542
556
568
425
495
602
999
617
653
843
AB20
$
Net investment in PPE
=Z21-AA21
=Z22-AA22
AC20
$
Payments for business acquisitions, net of cash acquired
0
411
86
69
-38
22
0
0
166
0
-106
-3557
149
1124
641
855
6793
11248
391
8102
10480
141
167
49
AD20
$
Proceeds from business divestiture, net
0
0
0
0
0
0
0
89
35
448
117
0
0
0
0
0
0
0
0
125
89
87
0
6
AE20
$
Acquisitions minus divestitures
=AC21-AD21
=AC22-AD22
AF20
$
Purchase of assets under capital leases
0
0
0
0
0
0
0
0
0
0
0
0
0
0
0
19
0
30
131
122
10
12
3
113
AG20
$
Purchase of assets under financing arrangements
0
0
0
0
0
0
0
0
0
0
0
0
0
0
0
0
57
0
283
0
0
0
0
0
AH20
$
Trade receivables sold
0
0
0
0
0
0
0
0
0
0
0
0
0
0
0
0
0
0
0
1700
2800
3510
4241
9627
AI20
$
Comprehensive income
0
0
0
0
0
0
0
0
0
0
3790
3790
356
2737
2737
3457
2620
6237
7337
7715
4478
-14711
6894
2910
AJ20
$
Net investment in PPE and acquisitions
=Z21-AA21
=Z22-AA22
AK20
$
Capex, net PPE + net acquisitions
=AB21+AE21
=AB22+AE22
AL20
$.cc
Net investment in PPE per share
=AB21/Q21
=AB22/Q22
AM20
$
Operating cash flow – net PPE
=X21-AB21
=X22-AB22
AN20
$
Operating cash flow – net PPE – net acquisition costs
=X21-AK21
=X22-AK22
AO20
$.cc
Operating cash flow per share
=X21/Q21
=X22/Q22
AP20
$.cc
Net PPE per share
=AB21/Q21
=AB22/Q22
AQ20
$.cc
Acquisitions minus divestitures per share
=AE21/Q21
=AE22/Q22
AR20
$.cc
Capex, net PPE + net acquisitions, per share
=AP21+AQ21
=AP22+AQ22
AS20
$.cc
Operating cash flow – net PPE, per share
=AO21-AP21
=AO22-AP22
AT20
$.cc
Operating cash flow – net PPE – net acquisitions, per share
=AO21-AR21
=AO22-AR22
AU20
$.cc
Operating cash flow per share (copy)
=AO21
=AO22
AV20
$.cc
Cumulative capex (net PPE + net acquisitions), per share
=AR21
=AV21+AR22
=AV22+AR23
AW20
$.cc
Cumulative Operating cash flow per share
=AO21
=AW21+AO22
=AW22+AO23
AX20
%
Operating margin
=I21/H21
=I22/H22
AY20
%
Net margin
=J21/H21
=J22/H22
AZ20
%
Operating cash flow margin
=X21/H21
=X22/H22
BA20
%
Operating cash flow minus net PPE margin
=AM21/H21
=AM22/H22
BB20
%
Operating cash flow – net PPE – net acquisitions margin
=AN21/H21
=AN22/H22
BC20
$
Increase in Trade receivables sold
0
=AH22-AH21
=AH23-AH22
BD20
$
Cash & cash equivalents
–
641
889
1,357
1,973
2,885
3,072
4,046
5,411
3,415
4,197
11,192
14,188
12,663
13,911
16,400
11,293
10,153
13,279
10,929
8,043
11,301
12,163
15,133
BE20
$
Cash equivalents
–
–
–
–
–
–
–
–
–
–
–
–
–
–
–
–
–
7,622
10,520
7,561
5,348
8,332
9,039
12,687
BF20
Cash
BF38
$
=BD38-BE38
=BD39-BE39
BG20
$
Cash equivalents + avail-for-sale investments
–
–
–
–
–
–
–
–
–
–
–
–
–
–
–
–
–
7,815
11,003
8,010
5,910
9,229
9,809
13,404
BH20
$
Available-for-Sale Investments or Securities
–
–
–
–
–
–
–
–
0
328
670
654
585
403
100
78
290
478
474
=BG40-BE40
=BG41-BE41
=BG42-BE42
=BG43-BE43
=BG44-BE44
BI20
$
Cash & cash equivalents + avail-for-sale investments
–
–
–
–
–
–
–
–
=BD29+BH29
=BD30+BH30
=BD31+BH31
=BD32+BH32
=BD33+BH33
=BD34+BH34
=BD35+BH35
=BD36+BH36
=BD37+BH37
=BD38+BH38
=BD39+BH39
=BD40+BH40
=BD41+BH41
=BD42+BH42
=BD43+BH43
=BD44+BH44
BJ20
$
Short-term investments
–
394
755
1,121
643
442
1,497
21
179
592
139
237
403
311
18
22
152
93
55
–
–
–
–
–
BK20
$
Total current liabilities
–
5,094
6,868
8,230
10,944
10,623
11,219
13,473
14,321
15,197
13964
24310
25,469
28,588
31,460
35,850
39,260
52,939
43,003
49,403
50,442
46,666
45,521
43,735
DISCLAIMER: Your investment is your responsibility. It is your responsibility to check all material facts before making an investment decision. All investments involve different degrees of risk. You should be aware of your risk tolerance level and financial situations at all times. Furthermore, you should read all transaction confirmations, monthly, and year-end statements. Read any and all prospectuses carefully before making any investment decisions. You are free at all times to accept or reject all investment recommendations made by the author of this blog. All Advice on this blog is subject to market risk and may result in the entire loss of the reader’s investment. Please understand that any losses are attributed to market forces beyond the control or prediction of the author. As you know, a recommendation, which you are free to accept or reject, is not a guarantee for the successful performance of an investment.
