Disclosure – I’m long Ubiquiti Networks, Inc. (UBNT).
Closing price February 17, 2015: $29.44
Short profile
From the company’s 10-K – “Ubiquiti Networks develops high performance networking technology for service providers and enterprises.” The service providers are typically Wireless Internet Service Providers (WISPs). “Our technology platforms deliver highly-advanced and easily deployable solutions that appeal to a global customer base, particularly in under-networked markets.” They are able to price disruptively due to their business model, which I describe later.
About this piece
This is mostly about illustrating the volatility of the company’s revenue, a peripheral issue which is not as important as the long term prospects, or even the prospects for launches and upgrades when they can have a significant effect on results. However you aren’t likely to find the product types and geographies charted anywhere else.
While anyone who has studied the company will know about the volatility, IMO it’s still worth charting the quarterly revenue from the geographic and product segments. The charts are more important than the writing, and the trendlines and R-squared values in the charts are secondary. In fact the R-squared values are low, indicating volatility and showing the trendlines can’t be projected reliably. There may be some irony in using quarterly charts to show you shouldn’t read too much into the latest quarterly change.
Before the quarterly revenue charts I look at mostly annual data for cash flow, revenue and earnings, for a longer and more comprehensive view.
Cash flow
The first chart is based on annual data from the cash flow statements. It tunes out most of the quarterly noise, but it has its own noise. The chart shows a recent dip in the operating cash flow (OCF) per share, which is still very high compared to the capital invested per share.

—————————————————————————————————————
The OCF dip is the result of big swings under “Changes in operating assets and liabilities:” –
($ thousands)
2014 ~ 2013 ~ 2012
Accounts receivable
(18,329) ~ 38,664 ~ (36,648)
Inventories
(33,764) ~ (8,996) ~ (2,266)
Those are the contribution to cash from the change over the previous year, and (33,764) is negative meaning Inventories increased by 33,764 ($ thousand). Big increases in Inventories and Accounts receivable can be warning signs of problems, but there are good explanations for the rises in Ubiquiti’s case. One factor is that with the CEO having a majority holding, and with the company having good net cash and cash flows, there’s no pressure on the CEO to manipulate earnings (some forms of earnings manipulation can lead to increased receivables).
Inventory is built up before product launches. There was also a decision to increase inventory to avoid stock-outs, which I wrote about in “Ubiquiti Networks – long term sense meets a short-sighted market” May 13, 2014.
My conclusion about the ‘changes’ part of cash flow is that receivables and inventories will not increase relentlessly, and for various reasons cash flow was effectively pulled into 2013. The drop in OCF in 2014 does not negate the underlying trend. The trend in cash flows is important and a one year blip is not, so long as the blip has a good enough explanation.
Ubiquiti’s fiscal year ends on June 30 and there have been two quarters reported since 2014 (the last point on the chart).
(thousands, except per-share quantities)
Q1 2015 ~ Q2 2015
Shares (diluted)
89,913 ~ 89,737
OCF
$46,942 ~ $32,676 (calculated for Q2)
Cash invested
$3,461 ~ $4,930 (calculated for Q2)
OCF per share
$0.5221 ~ $0.3641
Cash invested per share
$0.0385 ~ $0.0549
Annualized OCF per share (x4)
$2.0883 ~ $1.4564
Annualized Cash invested per share (x4)
$0.1540 ~ $0.2198
Cash flow has been affected by greater Days Sales Outstanding, as distributors who have built up a good credit history have been allowed to take longer to pay and bigger distributors have been signed up (who expect more time before they have to pay).
Distributors
Because I mentioned distributors taking longer to pay, I need to explain why Ubiquiti do not depend on distributors creating sales. About an internet forum refered to as the Ubiquiti Community –
- “Word of mouth referrals from the Ubiquiti Community generate high quality leads for our distributors at relatively little cost.” (10Q for Q2 2015)
That makes distributors keen to sign up, and with the pull from customers there’s no need to push the products through the channels, and no pressure to offer discounts to distributors.
Using the cash
With plenty of cash and low investment needs, it makes sense to use the cash to fund inventory and receivables, within reasonable limits, when it helps to increase sales. (See the earnings call transcripts on Seeking Alpha for more information.) One alternative – to use the cash for acquisitions – is limited by the low headcount which results from the lean business model. An acquisition candidate with half of Ubiquiti’s revenue is likely to employ far more staff than Ubiquiti, demanding more management attention and diluting the benefit from the business model.
Annual revenue 2010 to 2014
I’m about to investigate five years of annual revenue data using statistical methods. Given the short data set and the variation, I’m not surprised that the results were inconclusive. If you don’t mind negative results, or if you want to repeat the online test yourself, read on, otherwise skip to the three charts below.
In this short series of revenue data, 1 corresponds to 2010, 2 to 2011, etc. –
- ($ thousands)
1 136,952
2 197,874
3 353,517
4 320,823
5 572,464
I fed the data into the Linear Regression Analysis page on The Chinese University of Hong Kong. You can repeat the exercise if you like, but you need to navigate via “Data modelling” and “Linear Regression”. Then put “5” into the “Number of rows” box, and copy and paste the data into the “Data …” box, and then click on the “Calculate” button. You should see the results –
- Model y = 99,397.3200x + 18,134.0800
Pearsons product moment correlation Coefficient(r) = 0.9342
Standard Error of Slope SE(b) = 21,922.3815
t-test for the significance of the slope = 4.5341 Two-tailed probability = 0.0201
95% confidence interval for slope 52,044.9763 to 146,749.6643
That means the low, mid, and high cases for revenue growth are approximately $52 million, $99 million, and $147 million (increase in revenue per year). The results imply only a 5% chance that the trend is for revenue to increase by less than $52 million or by more than $147 million, with a probability of 2.5% for each of the tails (the ‘out of range’ cases). The numbers can only reflect factors that have already had an effect on revenue, for example because Ubiquiti have not been affected by key personnel risk, the risk is not factored into the range of slopes (the slope of the graph is the increase in revenue per year). On the other hand, the period includes infringement of Ubiquiti’s IP, and Ubiquiti are now better protected against the risk.
The stats site reports using “Pearsons product moment correlation Coefficient” which is the standard method. It assumes a normal distribution which in finance is a standard but not necessarily correct assumption (it’s assumed in the Black Scholes equation for pricing options, and fractals-genius Benoit Mandelbrot didn’t approve). While the calculations take the low number of data points into account, for a sample size as low as five, the results are less reliable.
Even at the high-limit of $147 million, linear growth would eventually become a miserably low percentage growth, so I put the same data into the Exponential Regression page. I’m not confident about the results because they were a bit different when I replaced 1, 2, 3 … with 2010, 2011, 2012 …, and the rate of exponential growth should not depend on the period labelling (if you decide year zero was when Elvis Presley was born, it wouldn’t affect the growth rate of trees, corporations, or anything not Presley related). The relevant lines from China were –
- Linear Regression Model of the log10 transformed value is y = 0.1452x + 5.0134
95% confidence interval for slope 0.0916 to 0.1989
I calculated the low, mid and high annual growth rates were 23.5%, 39.7% and 58.1%. I’m not confident about those, but the mid-range growth rate of 39.7% applied to the 2010 revenue of 136,952 would turn it into 521,620 by 2014, which is less than the actual figure of 572,464, but isn’t too far off and I wouldn’t expect a close match (all in $ thousands).
Even 23.5% annual revenue growth, at the bottom of the confidence interval, is a good growth rate, and given Ubiquiti’s margins it suggests good prospects.
The mid-case of $99 million linear growth only predicts annual growth of 17.3% in 2015 (from 99 / 572.464 = 0.173, not assuming any reversion-to-trend). But, the same $99 million growth would have been 72.3% growth over the 2010 figure of $136.952 million.
The Chinese University site does not show charts and only regresses linear and exponential functions. The problem is that the exponential function is concave-up, while other functions that could fit the data such as logarithmic are concave down.
In the chart on the right, below, the ‘concave down’ trendline implies growth that deteriorates faster than the linear trend, and the R-squared value is not far off the value for the ‘concave up’ exponential trend. If I’ve made statistics look indecisive, it’s better than being too sure about a trend. Five data points is not enough for very reliable results, meaning that even though a wider range of slope will be reported, the range is still less reliable. It would help if the points were all very close to the trend line, but that isn’t the case, and the three charts below confirm that it’s hard to fit a trend line with much confidence.

——————————————————————————————————————–
The fact that two very different trends fit about as well as each other, confirms my impression that while growth has been high, the data does not reliably indicate a likely rate of deceleration (growth companies usually slow down as they get bigger).
My long term expectation is that growth will hold up better than for most companies, due to the advantage of the business model, which can be applied to new products so long as ‘high-touch’ is not required and the forum can provide a useful function. The ability to stay lean and avoid bureaucratization is also a factor in delaying the onset of aging.
Revenue, earnings and margins


——————————————————————————————————————–
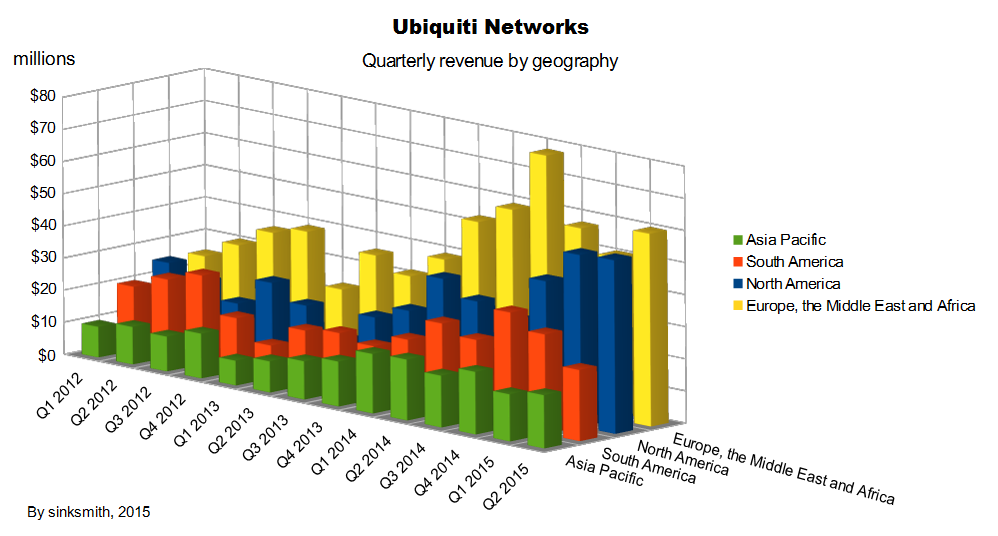
Quarterly revenue, total and by geography
Quarterly revenue has been variable. The sharp dip in Q1 2013 was the result of widespread IP infringement. The situation was serious but effective action was taken and UBNT recovered.

———————————————————————————————————————–
The trendline has an R-squared value of 0.742, which means it only explains 74.2% of the variation. IMO few such trendlines can be extrapolated with confidence, and this one is no exception. If you believe the trendline, then fluctuations around it account for 25.8% of the variation. The results from the Linear Regression Analysis page at The Chinese University of Hong Kong (linked to above) were –
- Model y = 6,946.1300x + 58,165.7300
Pearsons product moment correlation Coefficient(r) = 0.8616
Standard Error of Slope SE(b) = 1,181.4866
t-test for the significance of the slope = 5.8791 Two-tailed probability = 0.0001
95% confidence interval for slope 4,394.1188 to 9,498.1409
My method was to test the correlation between the sequence 1, 2, 3, … and the quarterly revenue figures 79167, 87817, 91665 … (If you want to check the result, you’ll need the data, which you can get via a link at the end under “Tables and formulas” with instructions to ‘Paste special’ into a spreadsheet.)
The last line in the results implies that you can be 95% confident that the underlying trend in revenue is between an increase per quarter of $4.4 million and $9.5 million, with a ‘model’ mid point of $6.9 million. That’s slower trend-growth than the annual data gave, which could be because the quarterly data starts at Q1 2012, while 2012 was a good year with a big rise from 2011. The “t-test” line means you can be extremely confident that the growth in the period was not just the result of random fluctuations.
By not showing the total revenue, the next chart shows the revenue from the four regions more clearly.

—————————————————————————————————————
Every region has experienced volatile revenue. While the two largest regions have demonstrated obvious and signigicant growth, that’s not quite as clear for APAC, and it’s quite arguable for South America (with only incremental growth between the first and last points). Any two regions you pick are capable of moving in opposite directions for a quarter or two (I quantify the low correlation using R-squared values in charts further on). Here I’ve added trendlines and shown their R-squared values:

—————————————————————————————————————
The R-squareds show the percentage of variation explained by the trendlines – 64%, 65%, 21% and 54%. Taking the square root of the R-squared numbers gives R, the correlation coefficient (for a trend, the correlation is between the variable with the trend, and time, for example the end date of a quarter). The values are 0.800, 0.806, 0.458, and 0.7345. Putting the R values into a page on the University of Hong Kong site (linked to above) gave “p” values of 0.0006, 0.0005, 0.0996 and 0.0028 (navigate with “correlation” / “stat sig of r”). Taking the highest p-value of 0.0996 which is for South America, it means that there’s nearly a one-in-ten chance of no linear correlation (meaning revenue is not linearly correlated with time, and may just fluctuate randomly, possibly about a mean), whereas the p of 0.0005 for North America implies only one chance in 2000 that there’s no underlying growth. The p values do not give much idea of the variability, but I believe you can get some idea just by looking at the chart, and R-squared gives the proportion of variation which is ‘on trend’. (If you want the variability of the slope and don’t mind some work, find “You can get all the data” (above), follow the instructions, and find “I fed the data into the Linear Regression Analysis page” (above).).
All the R-squareds in the chart above are lower than the 74% for the total revenue. It’s expected that a total such as total revenue will have less variation than the parts it’s the sum of, provided the parts can fluctuate independently, because sometimes the parts will move in opposite directions, and they’ll tend to move at different rates. That’s why a big conglomerate will have more stable results than most other companies, although as well as the number of subsidiares, its results are smoother the more diversified its markets are, the more stable its markets are, and it helps if the subsidiares are about equal in size. Ubiquiti will become more diversified if it becomes more established in new areas. Machine-to-machine would be such an area, but there doesn’t seem to be much focus on it at the moment, and video is more promising in the near term.
Here’s a 3D view of the same data (no special glasses required).
—————————————————————————————————————
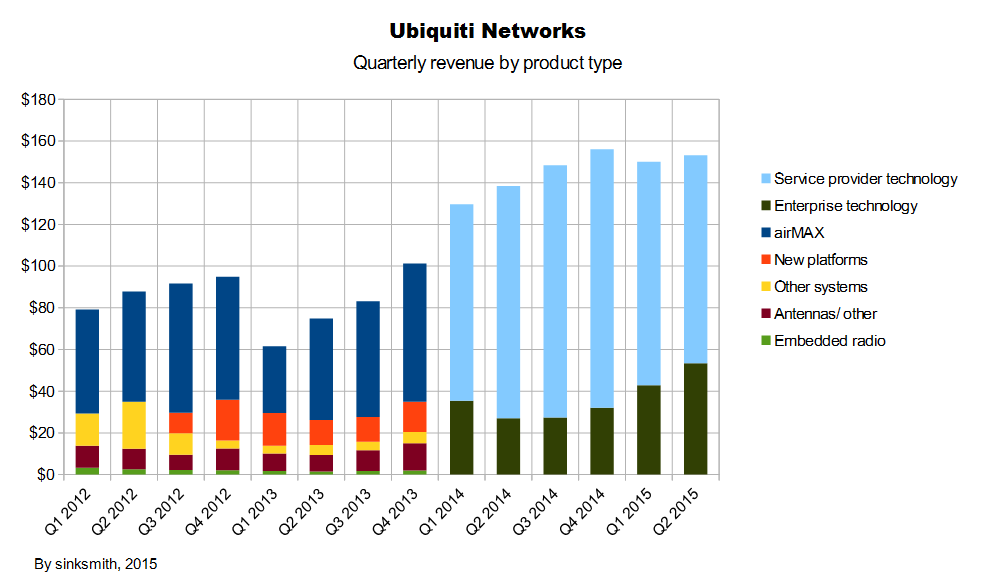
Quarterly revenue by product type
The product type charts are complicated by the change in disclosure which you can see by comparing either side of the gap. (New platforms, Antenna’s/other etc. can split between the later categories “Service provider technology” and “Enterprise technology”.)

—————————————————————————————————————
The next chart is for “Service provider” and “Enterprise” only, with trendlines fitted, but six points is a small number to use in a statistical test, especially when the R-squared values are low. I saw no point in putting the data into any further statistical test. There are reasons to believe that ‘Service provider technology’ will grow, but there’s a big lack of evidence for it in the chart and the R-squared value of only 0.01.

—————————————————————————————————————
The stacked view of the same data lets you compare the revenue of a product type to the total revenue.
—————————————————————————————————————
And in glorious 3D:

While Service provider technology rose and fell, Enterprise technology fell then rose. It’s highly unlikely that there’s an underlying inverse relationship which would reliably predict movement in opposite directions in the future.
It’s not worth extrapolating a few quarters
While the overall growth of revenue is evident, the conclusion I draw from the quarterly ‘geography’ and ‘product type’ charts is that it’s hard-to-impossible to make a meaningful short-term prediction based on any of them. Analysts can put too much emphasis on the latest quarter’s results (maybe it’s in their job description), and some commentary can be knee-jerk over items like an increase in inventory in a quarter.
Currency and emerging markets headwind
While a dip in total revenue could easily be the result of the two product types happening to have a random dip at the same time, or the consequence of geographies happening to move down at the same time, there is currently a headwind. Much of Ubiquiti’s revenue is from emerging markets, especially where the telecoms infrastructure is not very developed. Those markets in particular could be affected by the strong dollar. Countries with an especially weak currency will be more affected, and countries that depend on oil exports or other depressed commodities are likely to have weak currencies and weak economies.
Ubiquiti are far from unique in being affected by dollar strength (Proctor & Gamble had a fair amount of publicity when their results suffered from it). I started warning on November 3, 2014 (before most of the Ruble’s fall) of the risk that a strong dollar and massive dollar-denominated debt could put some countires into crisis, with some similarity to the 1990s when Mexico, Asia and Russia were hit. That could still happen and is under-appreciated, but at least now there is general awareness that the strong dollar is a problem for exporters, and of weakness in emerging markets and primary producers, especially where the geopolitics has been in the news. Guidance seemed to build in a lot of downside for the effect of weak foreign currencies and weak emerging markets (my impression from the CC transcript), IMO leaving upside if Ubiquiti’s overseas markets are not hit as hard as feared, or if the company outpaces those factors. While the market is aware of the adverse factors (currency risk, low oil price, depressed commodities, weak emerging markets), the share price seems to indicate it is either not aware of the advantage of Ubiquiti’s business model, doesn’t believe it, or doesn’t care due to a short-term focus.
The business model
Ubiquiti concentrates on R&D, and outsources manufacturing. A vibrant forum gives feedback about products (especially new products), provides support, and evangelizes the product. By not needing a large staff for sales and support, the company can keep prices at levels that are disruptive for the competition, while still keeping a good net margin. Ubiquiti have a prototyping facility in China which CEO Pera described as a factory in an answer during the Q1 2015 CC, but he explained it was purely so they can introduce new products faster.
The business model is intact. So long as the model stays intact, the best time to buy is when a real or imagined problem sends the share price down. The net cash, cash from operations, low investment needs and disruptive pricing mean that Ubiquiti can ride out problems and emerge stronger, as they did after their IP was widely infringed.
Keeping it brief
I’m trying to stick to the subject and not say too much about related issues. There are good authors writing about Ubiquiti on Seeking Alpha and for a wider treatment I’ll refer you to “Ubiquiti Networks: A Rare Opportunity In An Overvalued Market” by Mingran Wang, Feb. 11, 2015 (seekingalpha.com). It’s reasonable to ask “How can the business model be intact when there’s no evidence of growth in the revenue of the largest product type?”. I suggest reading Mingran’s piece and then see what you think.
Abitrary categorization
The geographies could have been organized differently, e.g. Africa could have been included with South America instead of Europe and the Middle East, or there could have been three regions or five instead of four. A different categorization would have made the geography charts look different, but the volatility can’t be magicked away by regrouping, and the regions would always be more volatile individually than their sum.
The geographies move fairly independently
I could be criticized here for applying linear regression (with a trendline) to sets of points that don’t look linear. My excuse is that the points don’t suggest any better curve, and I’m quantifyng the lack of much relationship, rather than saying “This is the formula that relates the variables.”. The lines indicate the order of the points, which start at Q1 2012 in the bottom left and end at Q2 2015 on the right. The order of the points is not relevant to the trend lines or the R-squared values.

—————————————————————————————————————
The R-squared values in the chart above correspond to 37%, 32% and 68%. The first two of those percentages are low, and they imply that revenue in the second and third biggest regions (North and South America) fluctuates fairly independently of the revenue from the biggest region (EMEA). Putting the data for EMEA and North America into the Hong Kong site’s Linear Regression page got the result
- “95% confidence interval for slope 0.0911 to 0.9055”
In other words, on average, for every $100 million per quarter that EMEA grows by, North America would grow by at least $9.11 million and at most $90.55 million, with a 5% chance of being outside that range. (That’s about the uncertainty of the trend, not the noise around it.) The wide range reflects the 63% independent variation (from 1 minus R-squared), although the number of data points is also a factor. Common sense might suggest you can make the range narrower, but that brings in more information than the 2 x 14 array of numbers which went into the test.

The main point from the chart above is that the R-squared of 0.29 (or 29%) implies that revenue in the third biggest region (South America) fluctuates fairly independently of the revenue in the second biggest region (North America). With the previous result, all the regions except for the smallest (APAC) move fairly independently of each other. Although APAC has some dependence (statistically) on EMEA and North America, it’s still fairly low, and evidently not big enough to make EMEA and North America move in step.
Any time two quantities grow, there’s a statistical correlation between them, even when it’s obviously meaningless. For example, a baby walrus could happen to be growing at the same time as the economy of Japan, and statistically there would be a positive value of R-squared, very likely a higher value than some of the R-squareds above. The long term growth in Ubiquiti’s regions is clearly related, because it depends on factors like new product launches, the quality of the products, the business model that allows a low price point, and evangelizing on the forum (because the understanding of languages crosses over the regions). Without underlying growth, it’s likely that the R-squared values in the scatter charts would be even lower. In any case they are low enough to say that a short term upswing in one region can easily be accompanied by a move in the other direction for whichever other region you care to pick (though less so for APAC, the smallest region by revenue).
Regions can also move in the same direction purely through chance. As a hypothetical example, if there’s a 40% chance of any region having lower revenue in a quarter, and if the regions moved completely independently, then there’s a 16% probability of the two biggest regions both falling purely through chance, and a 6.4% probability of the three biggest regions falling purely through chance. Adjusting for the level of dependence would increase those probabilities.
If there was a 60% chance of any region having higher revenue in a quarter, and if the regions moved completely independently, then there’s a 36% probability of the two biggest regions both rising purely through chance, and a 21.6% probability of the three biggest regions rising purely through chance.
The subject raises the fairly tricky question, can the fluctuations really occur through chance when most people would agree that they have rational causes? My attitude is that, to the extent that you can’t predict the movements, they might as well be random (on top of a long term growth trend).
Ubiquiti would be more volatile if they only had one of the four regions, and the relative independence actually helps stability, just not enough to make revenue stable.
Limited evidence suggests the product types move fairly independently

The short data series for the current two product categories shows an inverse relationship (the slope of the trendline down to the right means that the more revenue it reads on one axis, the less revenue it reads on the other axis). The R-squared of 0.35 shows that 35% of the variation in Enterprise technology revenue is accounted for by the variation in Service provider technology. Apart from the fact that 35% is quite low and there aren’t many data points to base it on, it might not be a feasible relationship. Two explanations don’t seem likely – 1) customers with limited budgets who spend more on one product type have less to spend on the other (that probably fails because different product lines address different markets). 2) When Ubiquiti develop one product they have less resources for the other. Because Ubiquiti are not short of cash, the second explanation would have to mean a shortage of R&D staff or of management time for managing them, but it seems unlikely that either product type has been short of development effort. If there’s no underlying inverse relationship, the product type revenues are likely to be more independent of each other than the R-squared of 0.35 suggests.
While I don’t believe the product types have an underlying inverse relationship, it’s still true that they have tended to move in opposite directions, but that has not been enough to make the overall revenue very stable or stop it from falling since Q4 2014.
Why Ubiquiti’s revenue is volatile
Ubiquiti supply high-tech capital equipment, with significant sales to emerging markets. Revenue from new models is hard to predict. Upgrades are a relatively more reliable source of revenue, but there’s no recurring revenue. Given those factors, it’s remarkable how steady the growth in OCF has been, and it would have been steadier if the swings in inventory and receivables had been smaller.
Stock price volatility
The share price is also volatile, and probably over-reacts to results and headwinds. That may be understandable for a few reasons. The CEO holds most of the stock and is hanging on to it. The staff hold stock, and some customers who were impressed by the technology available for the price may also hold stock. Shareholders with experience of the company may be less likely to trade.
While the articles and comments on Seeking Alpha might not represent the attitude of small investors, there is general agreement in the articles and comments that Ubiquiti are a good long term investment. The investors there may add when the price is low, and a few might take some profit when prices are high, but the attitude seems weighted towards holding long term rather than trading.
With many of the shares effectively not for sale, the share price can move up fairly sharply. Lately the movement has been down (since September, with a small uptick after the Q2 results). The size of the slide may be greater because small shareholders are unable or unwilling to add much at lower prices, for whatever reason.
Another factor is that the company uses its cash to buy back shares, but only when the price is fairly obviously low. I don’t follow the short selling much, but the short % of float seems to be around 30% quite often. There’s info from NASDAQ, and the Morningstar link at the top gives the short % of float.
Also, while a results surprise or disappointment is likely to be temporary, there isn’t a clear trend for results to revert to, which could discourage traders who aim to ‘buy low, sell high’ rather than follow momentum. There will also be investors who add when the price is low, with the general expectation that the long term prospects are good (which is usually my approach).
Seeing patterns in randomness
It’s often said that people see patterns where no pattern exists. There’s a recent case concerning random playlists, with users believing they are not random and there’s some kind of conspiracy. The solution has been to tweak the results of the standard and well-founded algorithms to conform to common misconceptions of what a random sequence should be like. (I heard that on BBC radio but I can’t find it on the internet. The subject area is covered in the book “Fooled by Randomness” by Nassim Taleb. Also see “Patternicity” and “Apophenia“.) It seems at least possible that when analysts try to abstract something meaningful from quarterly results, sometimes they find it when it doesn’t exist. I could fall into the same trap myself, and it’s hard to ignore quarterly results.
Conclusion
Ubiquiti’s parts move fairly independently, but they are volatile enough that the sum of them is still volatile, though less volatile than any individual geography or product type. While volatility in the results and the share price creates opportunities for trading, it would be a waste of a good business model to only trade and avoid long term investment, especially when volatility has contributed to a good share price for entry or adding.
Tables and formulas
See “Spreadsheets for Ubiquiti Networks – charts and volatile revenue“.
Data in semicolon-seperated format with instructions to ‘Paste special’ into a spreadsheet, formulas not included – “Data for Spreadsheets for Ubiquiti Networks – charts and volatile revenue”
This is fairly advanced. For each trend line, it would be nice to have a line above and a line below representing “regression channels” (aka “confidence channels”), which you might have seen in technical analysis. IMO the trend lines here have too much uncertainty about the slope for that to be more useful than potentially misleading. If you want to know more, try How do I calculate confidence channels above and below a trend line. Find “richdiesal2009-03-15 at 20:13:39” for the comment I think is most relevant.
A simple guide – “Using Linear Regression to Predict an Outcome” by Deborah J. Rumsey, PhD from Statistics For Dummies, 2nd Edition (dummies.com).
DISCLAIMER: Your investment is your responsibility. It is your responsibility to check all material facts before making an investment decision. All investments involve different degrees of risk. You should be aware of your risk tolerance level and financial situations at all times. Furthermore, you should read all transaction confirmations, monthly, and year-end statements. Read any and all prospectuses carefully before making any investment decisions. You are free at all times to accept or reject all investment recommendations made by the author of this blog. All Advice on this blog is subject to market risk and may result in the entire loss of the reader’s investment. Please understand that any losses are attributed to market forces beyond the control or prediction of the author. As you know, a recommendation, which you are free to accept or reject, is not a guarantee for the successful performance of an investment.
